What is Applova Analytics?
Applova Analytics helps merchants monitor store performance, track sales trends, analyze product and customer activity, review promotion performance, compare results with previous periods, identify top-selling products and categories, and export reports from a centralized dashboard.
 Use Case Scenario
Sunrise Café wants a quick view of how the business performed last month without reviewing multiple reports.
The owner logs in to Applova Analytics, selects the business and date range, and can immediately:
View key metrics such as sales, orders, ticket size, and refunds.
Compare performance with previous periods.
Track sales trends and busy hours.
Review top-selling products and categories.
Analyze customer activity.
Monitor promotion performance.
With Applova Analytics, Sunrise Café can quickly identify trends, measure performance, and make informed business decisions from a single dashboard.
How to Access Applova Analytics?
Follow these steps to access the Analytics dashboard.
Step 1
Log in to the Applova Merchant Portal.
Step 2
Click on the "Analytics" icon in the top navigation bar.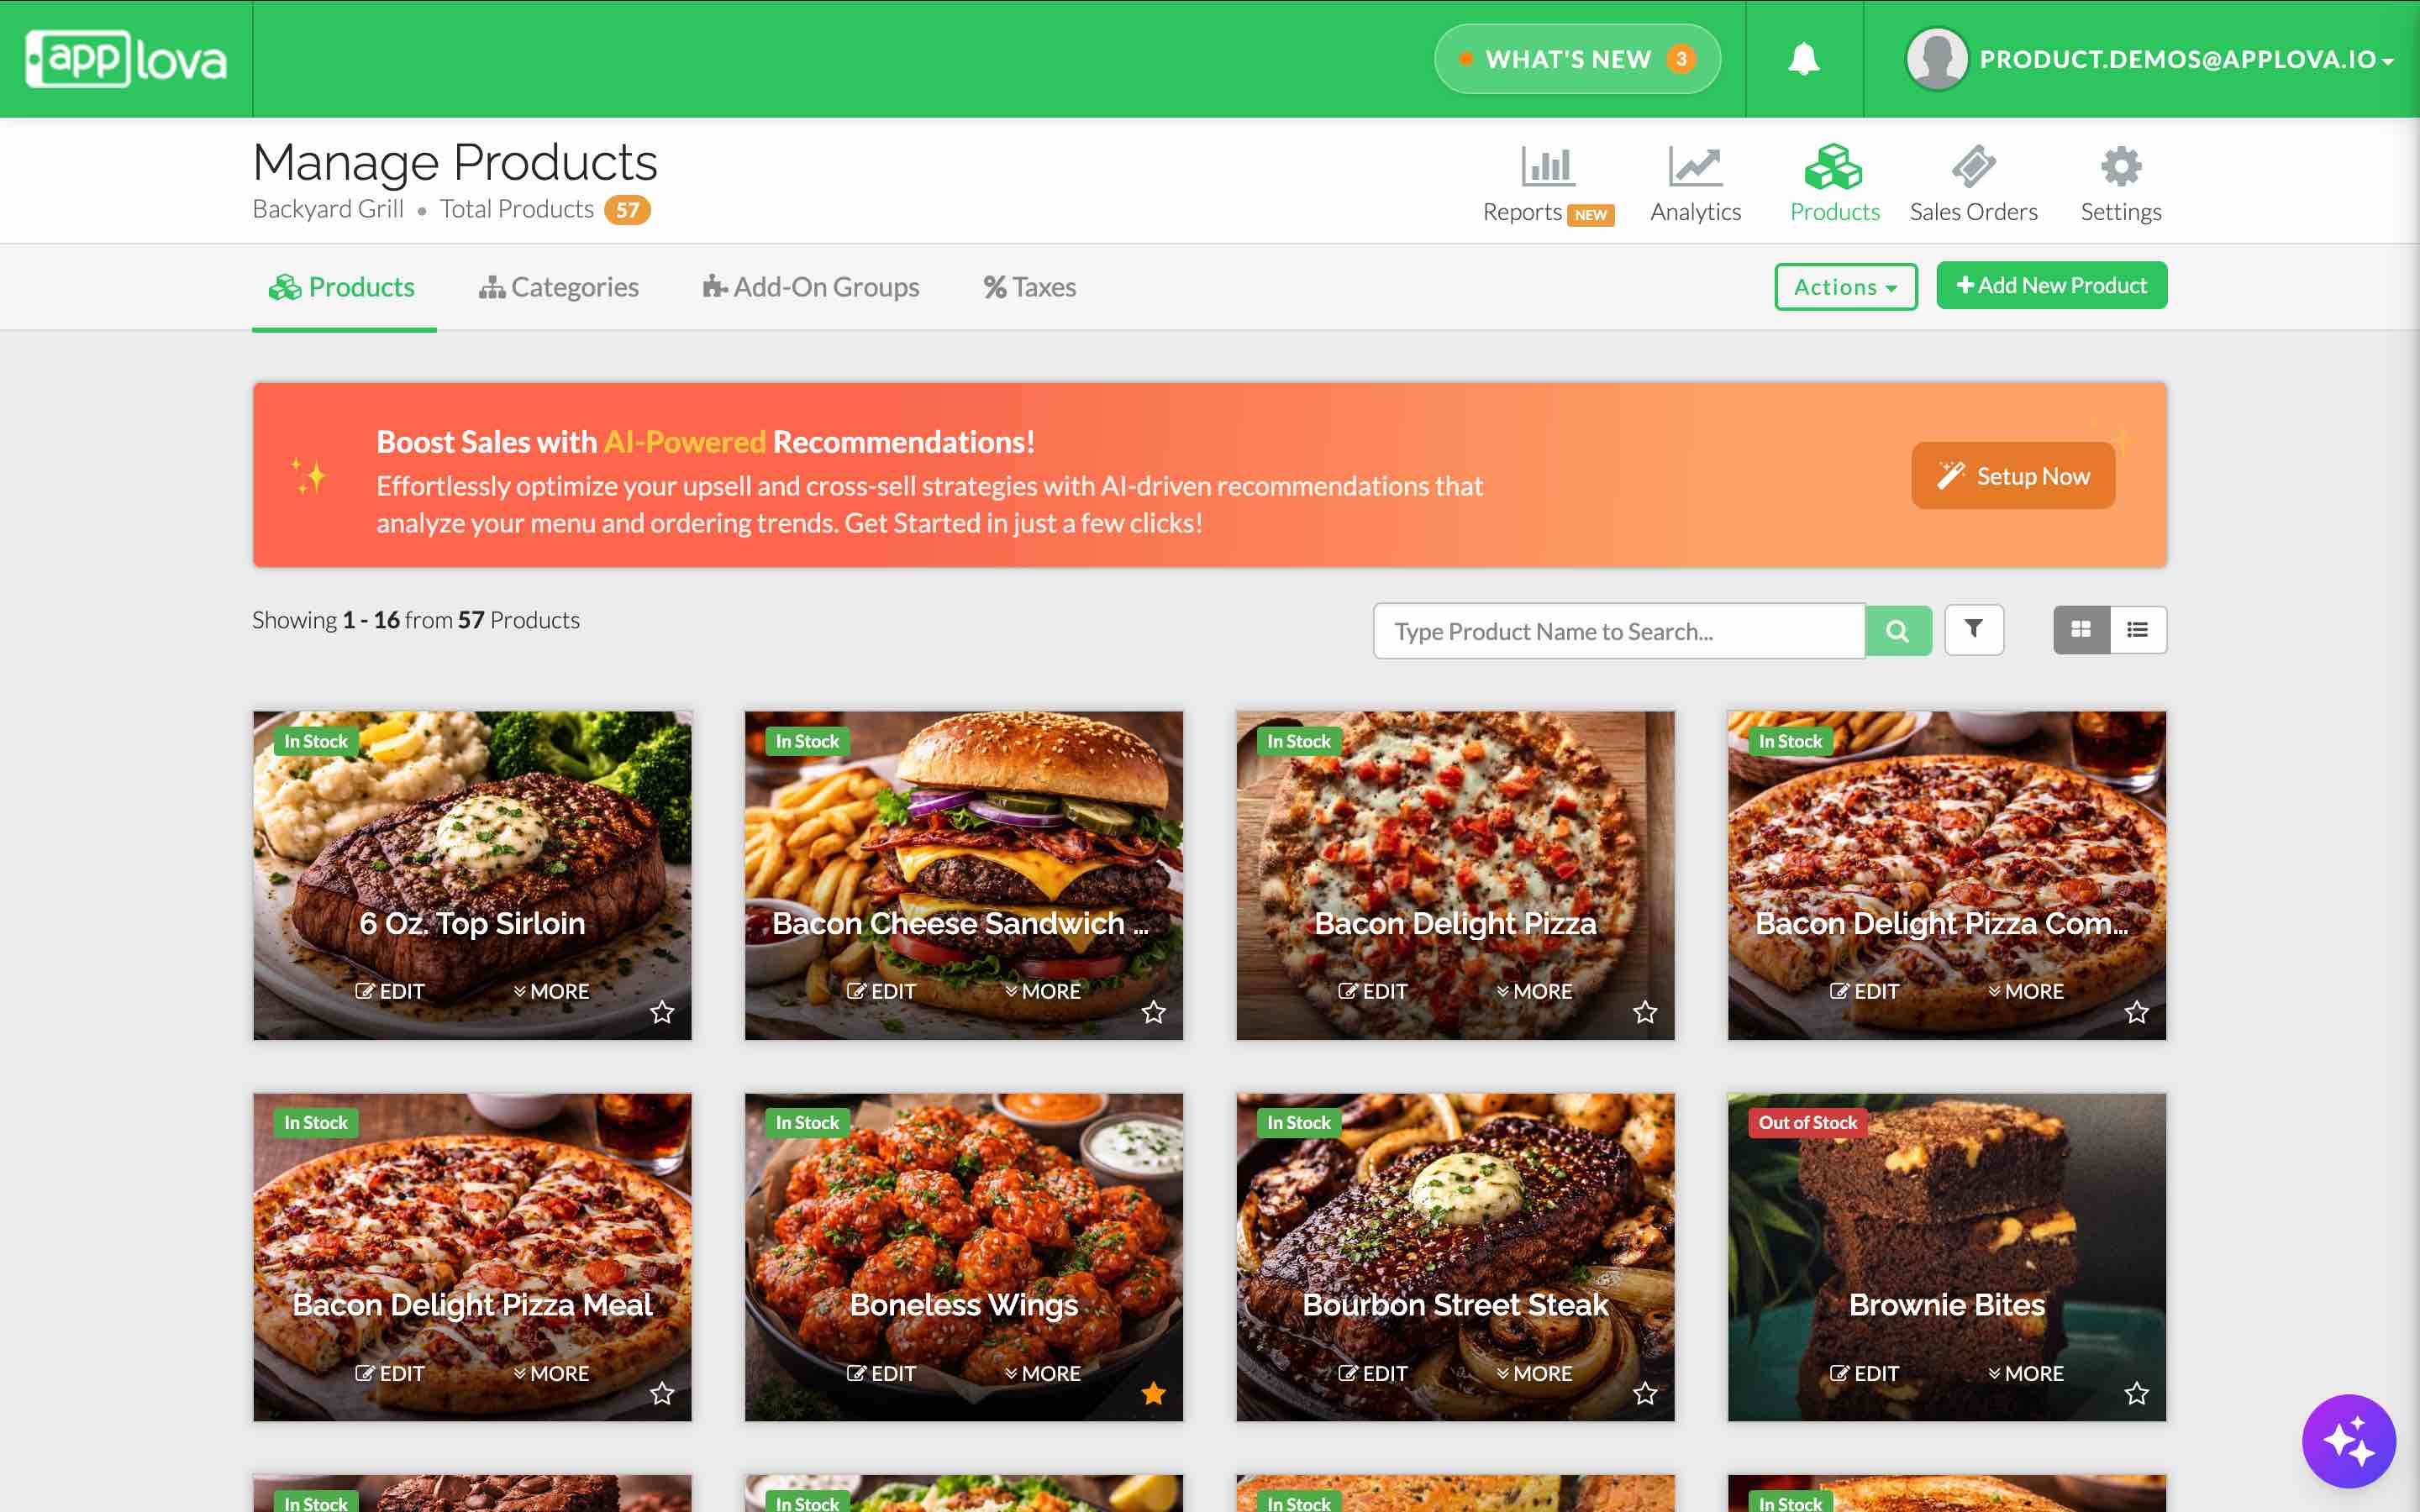
Image link
 Note: You can also access Applova Analytics directly through data-analytics.applova.io.
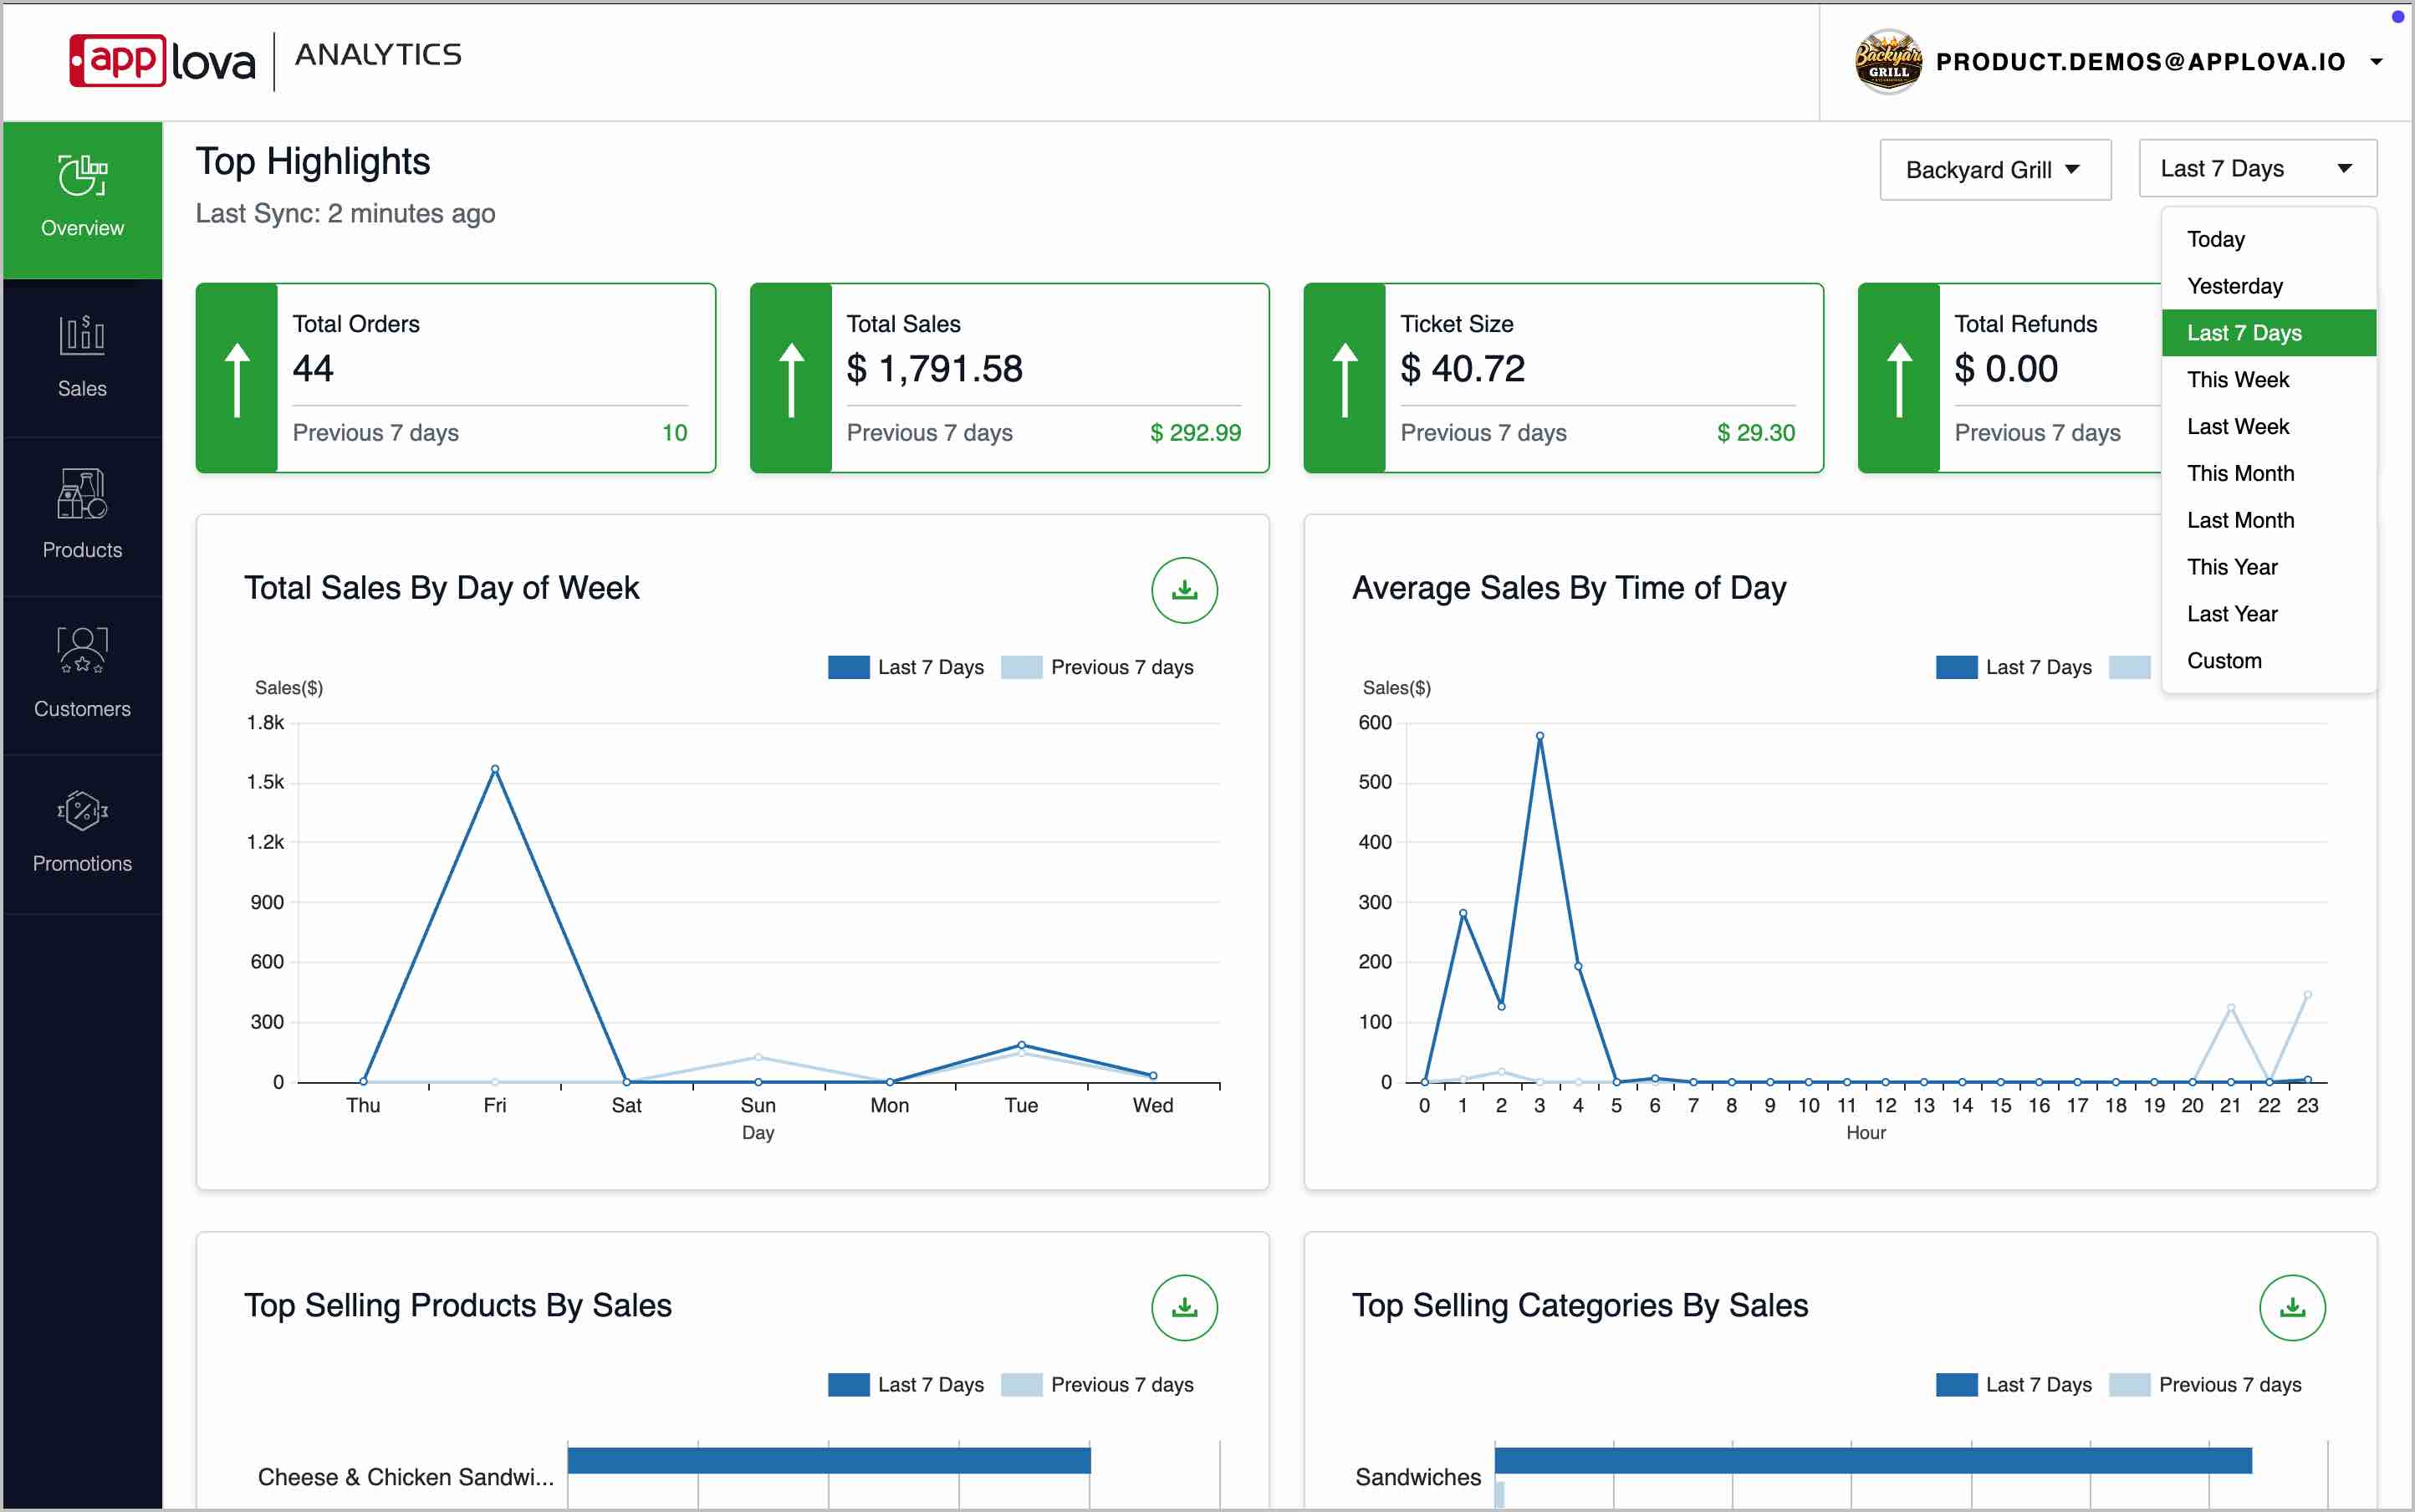
Step 4
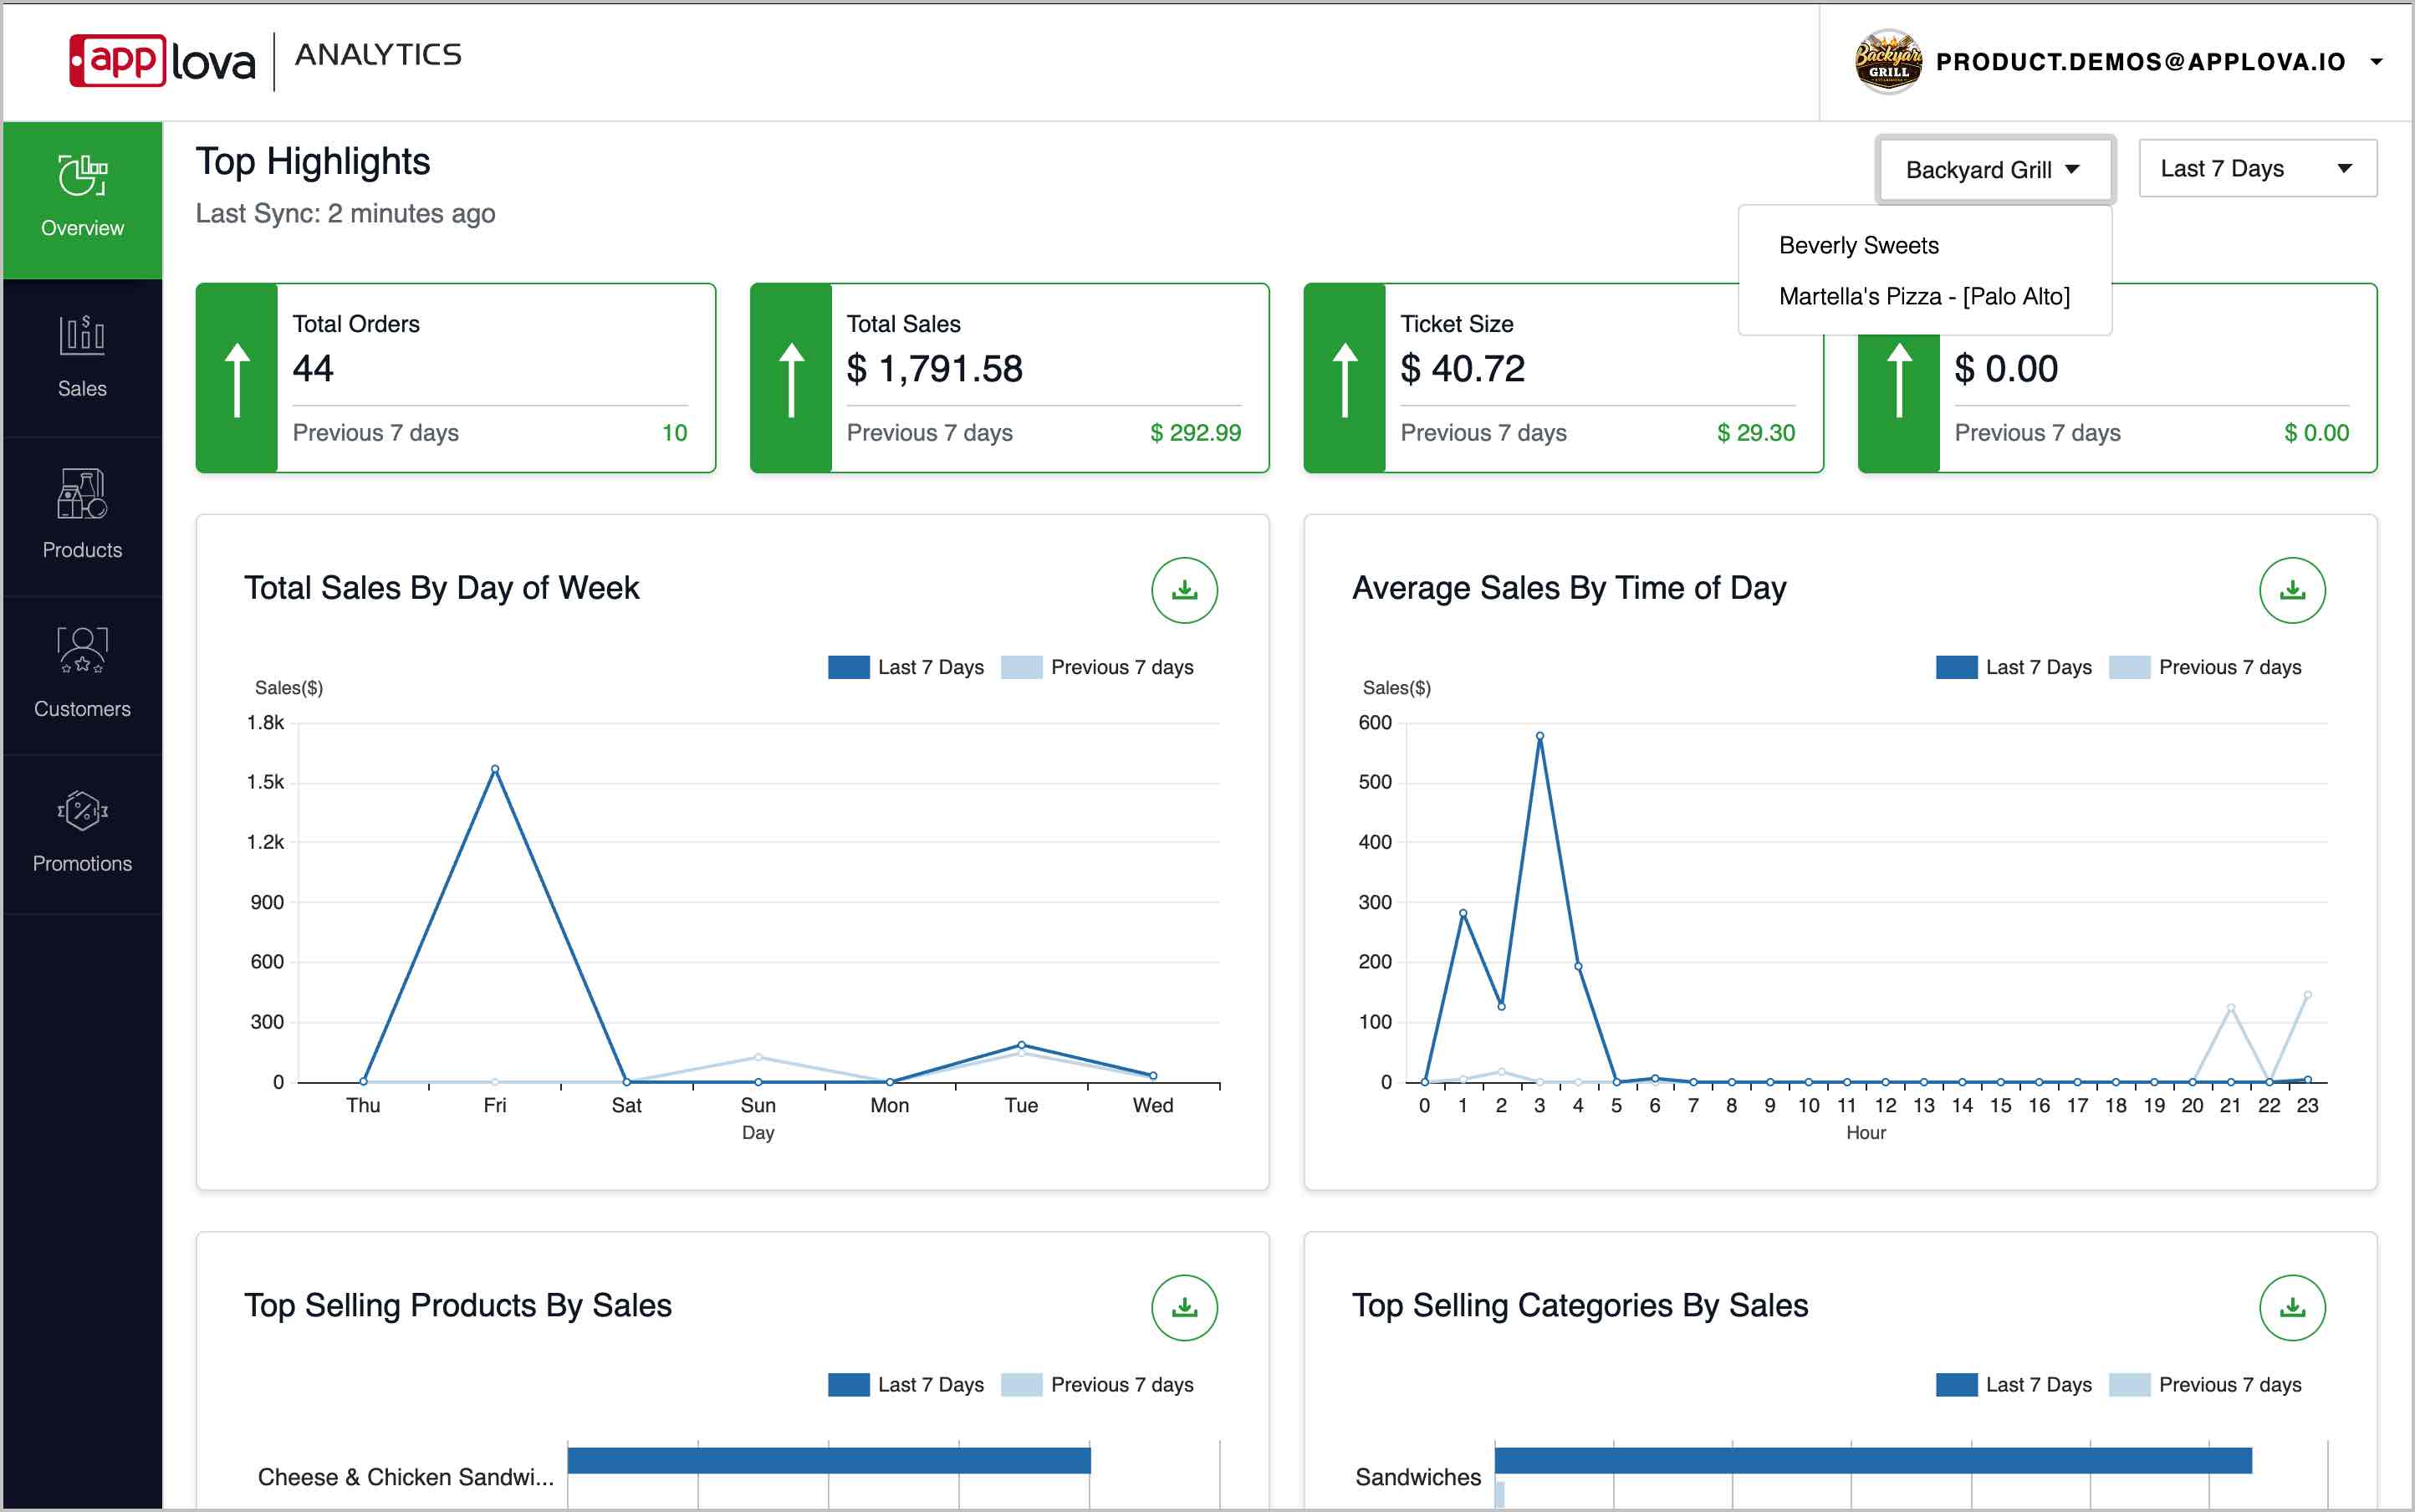
If you have access to multiple businesses, use the business dropdown at the top-right corner to select the required business.
What Is Included in Applova Analytics?
The Analytics Dashboard includes multiple sections in the left-side navigation bar.
Each section focuses on a specific area of business performance.
The main Analytics sections are:
Overview - View high-level performance highlights and key sales reports.
Sales - Review sales trends, collected amounts, discounts, tax, tips, and refunds.
Products - Identify top-selling products and product categories.
Customers - Identify top-selling products and product categories.
Promotions - Review how discounts and promotional campaigns perform.
Related Articles
Promotion Insights in Applova Analytics
The Promotions section helps merchants review promotion usage and promotional sales. Merchants can use this section to understand how many customers used promotions, how many orders included promotions, which promotions are active, and how much sales ...Overview Insights in Applova Analytics
The Overview section helps merchants quickly review overall business performance. Merchants can use this section to understand total orders, total sales, average ticket size, refunds, sales trends, top-selling products, top-selling categories, ...Customer Insights in Applova Analytics
The Customers section helps merchants review customer activity and engagement. Merchants can use this section to understand new customer signups, new customers served, returning customers, guest users, top customers, and all-time active customer ...Sales Insights in Applova Analytics
The Sales section helps merchants review sales performance in more detail. Merchants can use this section to understand sales trends, sales by channel, product and category performance, tax details, payment methods, and collected amounts. How to ...Product Insights in Applova Analytics
The Products section helps merchants review product and addon performance. Merchants can use this section to identify top-selling products, least-selling products, product sales totals, addon sales, and detailed performance for individual products. ...